Mariner 69 Mars Chart
Scale 1: 25 000 000
Mars — map
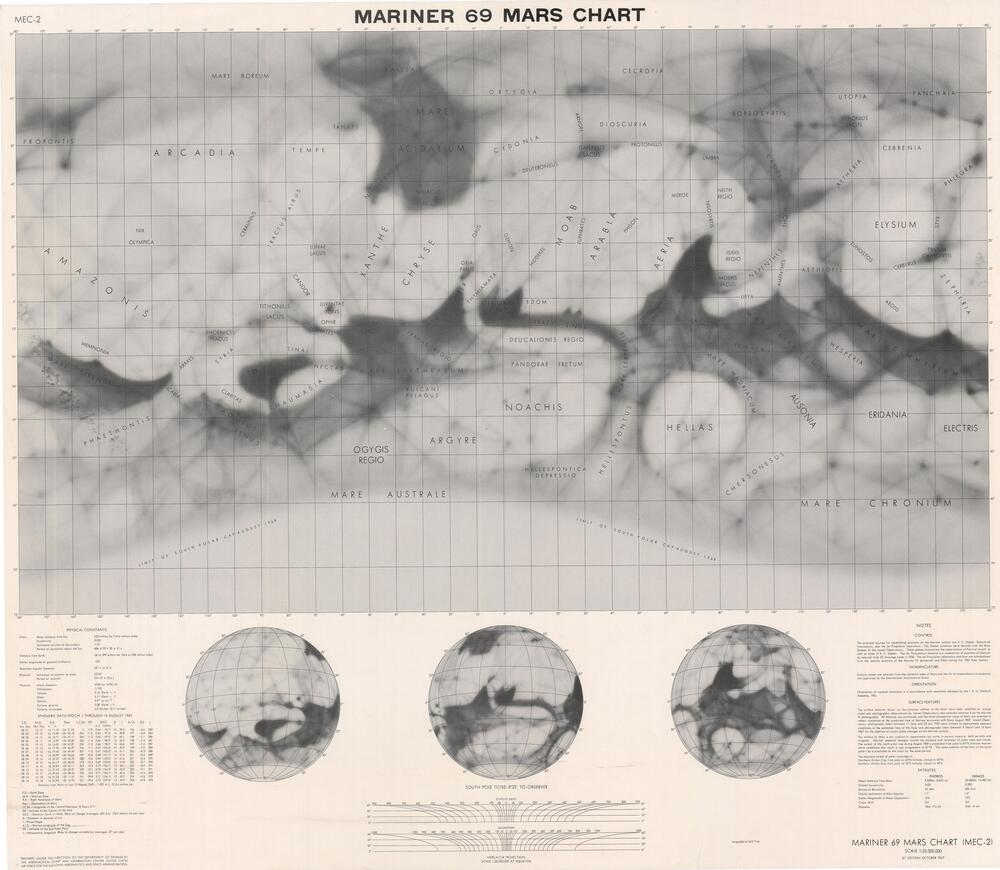
Prepared under the direction of the Department of Defense, Aeronautical Chart and Information Center, US Air Force for NASA
Control: EC Slipher, Gerard de Vaucouleurs, JPL. Source: drawings of 1958.
1:25M
1967

Map provided courtesy of the USGS Flagstaff Library.
CONTROL
The principal sources for establishing positions on the Martian surface are E. C. Slipher, Gerard de Vaucouleurs, and the Jet Propulsion Laboratory. The Slipher positions were derived from the Mars Globes of the Lowell Observatory. These globes incorporate the observations of Percival Lowell, as well as those of E. C. Slipher. The de Vaucouleurs material is a compilation of positions of features as reduced from 32 drawings made in 1958. The Jet Propulsion Laboratory positions are extrapolated from the relative positions of the Mariner IV spacecraft and Mars during the 1965 flyby mission.
NOMENCLATURE
Feature names are selected from the standard maps of Mars and the list of nomenclature as prepared and approved by the International Astronomical Union.
ORIENTATION
Orientation of cardinal directions is in accordance with resolution adopted by the I. A. U. General Assembly, 1961.
SURFACE FEATURES
The surface features shown on the previous edition of this chart have been modified to include visual and photographic observations by Lowell Observatory and selected features from the Mariner IV photographs. All features are portrayed, and the three perspective views of Mars are oriented to reflect conditions at the predicted time of Mariner encounter with Mars, August 1969. Lowell Observatory photographs taken between 11 June and 22 July 1954 were utilized to approximate seasonal conditions at the estimated time of the flyby on photographs taken between 9 March and 15 April 1967 for the addition of recent subtle changes on the Martian surface.
The surface of Mars is not constant in appearance, but varies in several respects both periodic and irregular. Martian seasonal changes include the advance and recession of polar caps and clouds. The extent of the north polar cap during August 1969 is predicted from pole to 87°N latitude; heavier storm conditions may result in cap progression to 81°N. The mean position of the limits of the south polar cap is predicted on this chart for the same period.
The maximum extent of polar coverage is:
Northern Winter—Cap from pole to 64°N latitude, clouds to 40°N
Southern Winter—Cap from pole to 55°S latitude, clouds to 40°S
Prepared under the direction of the Department of Defense by the Aeronautical Chart and Information Center, United States Air Force, for the National Aeronautics and Space Administration.